
I have spent years working with SaaS teams on growth, retention, and pricing. When people ask me what is churn in SaaS, I explain it in simple terms: churn is the rate at which customers or revenue leave your product over time. It is a silent leak in your bucket. If you ignore it, growth slows, and unit economics break. If you master it, everything else gets easier. In this guide, I’ll share clear definitions, real examples, proven tactics, and lessons learned from the field to help you reduce churn the right way.
Source: www.younium.com
What Is Churn In SaaS?
Churn is how much of your customer base or revenue you lose in a given period. Most teams track two versions: customer churn and revenue churn. Customer churn counts how many accounts cancel. Revenue churn tracks how much monthly recurring revenue you lose from downgrades, cancellations, or payment failures.
Think of churn like a leaky pipe. New signups add water. Churn drains it. Your job is to plug the leaks so growth compounds.
Key ideas:
- Customer churn rate measures account loss. Useful for product fit.
- Revenue churn rate measures dollars lost. Useful for pricing and expansion strategy.
- Net revenue retention shows how expansion offsets churn. Strong NRR can mask high logo churn, so track both.
Types Of Churn: Customer, Revenue, Voluntary, Involuntary
Understanding churn types helps you fix the right problems.
- Customer churn. The percentage of accounts that cancel in a period.
- Gross revenue churn. The percentage of MRR lost from cancellations and downgrades only.
- Net revenue churn. Gross revenue churn minus expansion revenue. Can be negative when upsells exceed losses.
- Voluntary churn. Users choose to leave due to value gaps, price, or competition.
- Involuntary churn. Payment failures, card declines, and billing issues. Often preventable.
- Active vs passive churn. Active is a user clicking cancel. Passive is accounts going dormant before leaving.
Why Churn Matters: The Business Impact
Churn is more than a metric. It shapes your whole model.
- Growth efficiency. High churn increases your acquisition targets. You must add more new MRR to stand still.
- Payback period. Churn lengthens payback on CAC. If customers leave before you recover CAC, you burn cash.
- Valuation. Investors prize net revenue retention and low logo churn. Healthy retention multiplies valuation.
- Product signal. Churn exposes fit, onboarding, pricing, and support issues.
- Forecasting. Stable retention makes revenue more predictable.
A small drop in churn can unlock big gains. Reducing monthly logo churn from 4 percent to 2 percent can double average customer lifetime.
How To Measure Churn (With Simple Formulas)
Keep it simple and consistent. Choose a period. Month is most common for MRR businesses.
- Customer churn rate = Customers lost in period ÷ Customers at start of period
- Gross revenue churn rate = MRR lost to cancels and downgrades ÷ MRR at start
- Net revenue churn rate = (MRR lost to cancels and downgrades − expansion MRR) ÷ MRR at start
- Net revenue retention = 1 − net revenue churn rate
- Customer lifetime in months ≈ 1 ÷ monthly customer churn rate
- Cohort churn. Track groups of users who started in the same month. Watch how many remain by month 3, 6, 12.
Tips:
- Exclude trial users from churn unless your funnel treats them as paying customers.
- Count churn on effective date of cancellation, not request date.
- Report both logo and revenue churn to avoid blind spots.
Benchmarks And Context By Stage And Model
Benchmarks vary by price, market, and motion. Treat them as guardrails, not gospel.
- SMB self-serve. Monthly logo churn of 3 to 7 percent is common. Aim for under 3 percent as you scale.
- Mid-market. Monthly logo churn of 1 to 3 percent. Aim for 1 percent or lower.
- Enterprise. Monthly logo churn of 0.5 to 1 percent or lower. Long contracts help.
- Gross revenue churn. Annual under 10 percent is strong. Under 5 percent is elite.
- Net revenue retention. 100 to 110 percent is good. 120 percent plus is excellent for expansion-led models.
Benchmarks depend on contract terms, seasonality, and billing setup. Compare yourself to similar models.
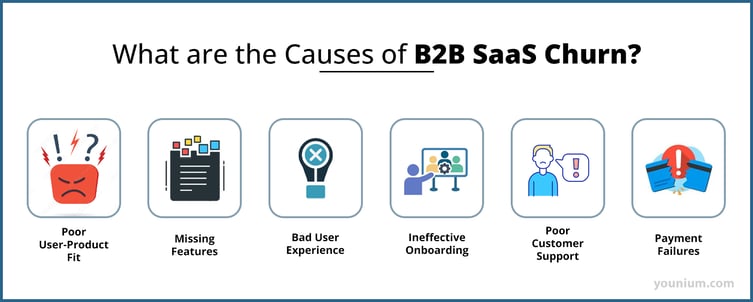
Root Causes Of Churn You Can Control
Most churn hides upstream in the journey.
- Poor activation. Users never reach the first win. Onboarding friction kills momentum.
- Weak product fit. The job to be done is unclear or not solved well.
- Pricing mismatch. Plans do not map to value moments. Perceived price is higher than perceived value.
- Slow support. Long response times create frustration and distrust.
- Lack of engagement. No reason to return. No triggers or workflows that build habit.
- Billing issues. Card failures, dunning gaps, and confusing invoices.
- Competitor pull. Better specialized tools or bundles.
Map churn reasons to moments. Fix the moment, not just the symptom.
How To Diagnose Churn (Step-By-Step)
Here is a simple playbook I use.
- Build a clean churn data set. Include user, plan, start date, cancel date, MRR, usage, and reason.
- Run cohort analysis. See where drop-offs spike. Month 1 spikes mean activation problems. Month 12 spikes may be renewal or budget cycles.
- Segment by plan, channel, company size, and use case. Churn is never uniform.
- Interview recent churned customers. Ask what outcome they sought, when value stopped, and what would have changed the decision.
- Watch session replays for churned segments. Look for friction.
- Run a save-offer test. Offer help, pause, or discount. Learn the true blocker.
- Quantify involuntary churn. Fix dunning and retries fast.
Make one change at a time. Measure for at least one full cycle.
Proven Ways To Reduce Churn
Focus on value, speed, and trust.
Activation and onboarding
- Define a single primary activation event. Guide all new users to it fast.
- Use checklists, templates, and empty states that drive action.
- Offer welcome calls or office hours for high-value tiers.
Product and engagement
- Add in-product nudges at the right moment. Celebrate first wins.
- Ship features that deepen habit, not just add surface area.
- Use lifecycle emails that align with milestones and usage.
Pricing and packaging
- Align plans to outcomes. Avoid locking core value behind higher tiers too early.
- Use annual plans with clear benefits to improve retention.
- Add usage-based elements only where value scales with usage.
Support and success
- Respond fast. Even a short first response builds trust.
- Add proactive alerts for drops in usage. Reach out before they churn.
- Offer pause plans for seasonal businesses.
Payments
- Use smart dunning with multiple retries, card updater services, and friendly reminders.
- Allow multiple payment methods and currencies if your market needs it.
Save flows
- Add cancel surveys with one-click options. Show targeted alternatives, pauses, or tailored offers.
Do not bribe unhappy users to stay. Fix the root cause first.
Real Lessons From The Field (My Experience)
A few stories that shaped how I think about churn.
- The onboarding aha. At one startup, 60 percent of churn happened in the first 30 days. We added a setup checklist and a 10-minute kickoff call for larger accounts. Activation rose by 22 percent. Month-one churn dropped by half.
- The price-value gap. Another team had strong adoption but kept losing small customers. The entry plan hid a critical feature. We moved that feature down and raised the price slightly. Churn fell, ARPU rose, and support load eased.
- Involuntary churn surprise. We found 30 percent of revenue churn was failed payments. A better dunning sequence and card updater recovered a third of it within two months.
- Renewal risk alerts. We built a health score using seat utilization, last login, and feature breadth. CSMs acted 45 days before renewal. Gross revenue churn improved by 4 points.
The lesson: small, targeted fixes beat sweeping changes.
Metrics To Track Beyond Churn
Churn lives in context. Pair it with these metrics.
- Activation rate. Users who reach the first value moment.
- Product adoption. Number of key actions per week or month.
- Feature breadth. How many core features are used per account.
- Net revenue retention and gross revenue retention. NRR and GRR tell the full revenue story.
- Expansion MRR. Upsells, cross-sells, seat growth.
- Support response and resolution time. Trust drivers.
- Payback period and LTV to CAC. Unit economics guardrails.
Track weekly, review monthly, act quarterly. Build a simple dashboard your team actually reads.
Frequently Asked Questions of what is churn in saas
Q. What is a good churn rate for SaaS?
It depends on your market and price point. For SMB, monthly logo churn under 3 percent is a solid goal. For mid-market, aim near 1 percent. Enterprise should be below 1 percent. Use your own trend as the most important benchmark.
Q. What is the difference between customer churn and revenue churn?
Customer churn counts accounts lost. Revenue churn counts dollars lost. You can lose few customers but a lot of revenue if big accounts downgrade. Track both.
Q. How do I reduce involuntary churn from failed payments?
Use card updaters, multiple retry schedules, friendly dunning emails, and clear invoices. Offer backup payment methods. Remind users before card expiry.
Q. Should I include trials in churn calculations?
Usually no. Only include paying customers in churn. Track trial conversion separately. If you count trials as customers, your churn rate will look inflated and unhelpful.
Q. What is negative churn?
Negative churn happens when expansion MRR from upgrades and add-ons is higher than MRR lost. This creates net revenue churn below zero and drives NRR above 100 percent.
Q. How long should I measure before trusting a churn change?
Wait at least one full billing cycle, often two to three for stable readouts. Seasonality and cohort differences can hide the true signal.
Q. Does annual billing reduce churn?
It often lowers logo churn by smoothing month-to-month decisions and improving commitment. It works best when paired with strong onboarding and value delivery.
Conclusion
Churn tells the truth about your product, pricing, and promise. Define it clearly, measure it simply, and fix it at the source. Start with activation, align value to price, and protect trust through fast support and clean billing. Small, focused changes stack up and can turn a leaky bucket into a flywheel.
Pick one area from this guide and act this week. Build a basic cohort chart. Improve your save flow. Or run two onboarding tests. Want more guides like this? Subscribe, leave a comment with your biggest churn blocker, or explore our retention resources next.
[Insert YouTube Video Here]