
You’re about to get a simple, expert take on what does SaaS quick ratio measure and why it matters. I’ve led growth reviews where this single metric made or broke a board deck. In plain terms, the SaaS quick ratio measures how fast you’re adding revenue compared to how much you’re losing. It shows if your growth engine is strong or leaking. If you care about healthy, durable growth, this metric is your early warning system and your proof of momentum.

Source: www.wallstreetprep.com
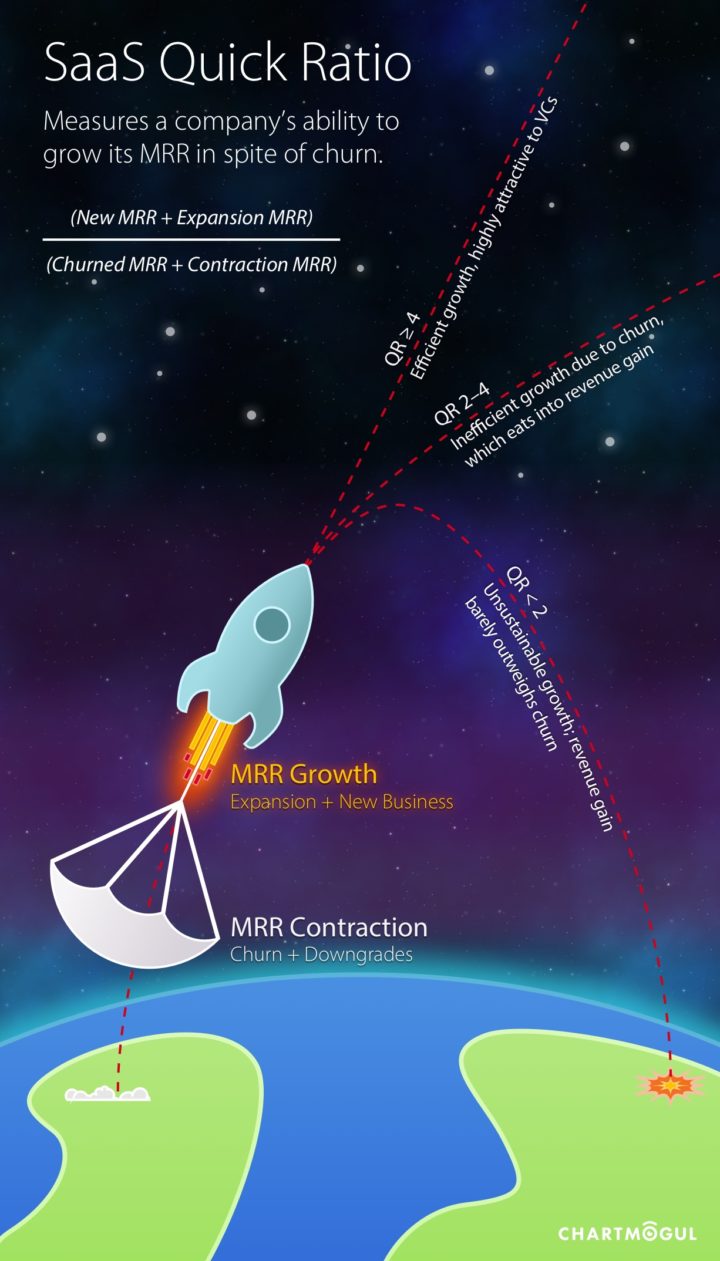
What The SaaS Quick Ratio Measures
The SaaS quick ratio tells you how your new and expanding revenue stacks up against lost revenue in a period. It shows growth efficiency. If you add more recurring revenue than you lose, your ratio goes up. If churn drags you down, it falls.
The standard formula most teams use:
Quick Ratio = (New MRR + Expansion MRR) / (Churned MRR + Contraction MRR)
New MRR is revenue from new customers. Expansion MRR is upgrades, cross-sells, or seat growth. Churned MRR is lost revenue from canceled accounts. Contraction MRR is revenue lost from downgrades or fewer seats.
What does SaaS quick ratio measure in one line? It measures the balance of revenue gains versus revenue losses, revealing if growth is resilient or brittle.

Source: www.wallstreetprep.com
Why It Matters For SaaS Growth
Investors and operators watch the quick ratio because it predicts momentum. You can grow top-line MRR and still hide weak retention. This metric exposes that risk. A strong ratio signals product-market fit and a loyal base. A weak ratio warns you to fix churn before you scale.
Benchmarks vary by stage, but here’s a simple guide:
- Above 4: Excellent. Growth is outpacing losses by a wide margin.
- 2 to 4: Solid. Likely healthy, but look closer at churn drivers.
- 1 to 2: Fragile. Growth could stall if market or sales slow.
- Below 1: Unhealthy. You are losing as fast as you add.
A higher quick ratio means more efficient use of cash, faster compounding, and better odds of hitting plan even when acquisition slows.
Source: chartmogul.com
How To Calculate It Step By Step
Use a consistent time window. Monthly is most common. Pull revenue by event type. Then apply the formula.
Steps:
- Choose a period. For example, March.
- Sum New MRR added in March.
- Sum Expansion MRR from upgrades in March.
- Sum Churned MRR from cancels in March.
- Sum Contraction MRR from downgrades in March.
- Compute Quick Ratio = (New + Expansion) / (Churn + Contraction).
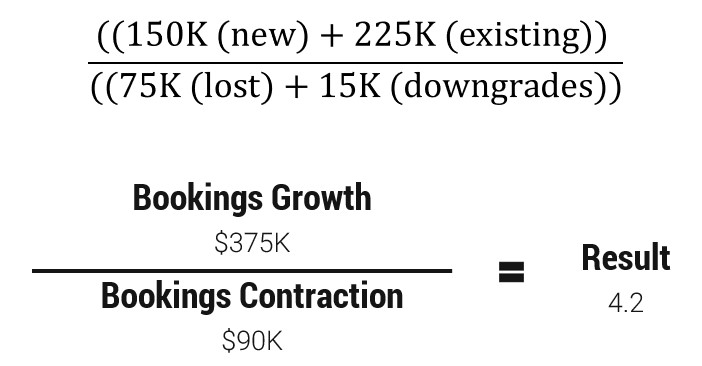
Example:
- New MRR: 40,000
- Expansion MRR: 20,000
- Churned MRR: 10,000
- Contraction MRR: 5,000
Quick Ratio = 60,000 / 15,000 = 4.0
That 4.0 suggests strong, efficient growth.
Source: www.thesaascfo.com
Common Pitfalls And How To Fix Them
Data leakage across months. Fix with clear event dates and a locked calendar close.
Mixing bookings with MRR. Use committed recurring revenue, not invoices or cash receipts.
Ignoring downgrades. Include contraction. Some teams skip it and overstate growth.
One-time spikes. Large enterprise deals can distort a month. Use rolling 3-month or 6-month averages.
Inconsistent definitions. Document what counts as new, expansion, churn, and contraction. Train ops and finance to tag events the same way.
Early-stage noise. Very small MRR swings can swing the ratio. Use a longer window or cohort views.
How To Improve Your Quick Ratio
Reduce churn first. It is easier to plug leaks than to pour more water in.
Practical moves:
- Tight onboarding. Guide new users to first value within days.
- Activation checklists. Track key actions that lead to habit.
- Proactive success. Flag at-risk accounts with usage alerts.
- Outcome-based QBRs. Tie your value to a business KPI, not features.
- Save offers with limits. Use targeted offers when the account still fits your ICP.
Increase expansion next:
- Price for expansion. Good-better-best plans, seat tiers, usage add-ons.
- In-product nudges. Time-limited trials of premium features.
- Land-and-expand motions. Start small, expand to new teams.
- Value-based packaging. Move top outcomes into higher tiers.
Sharpen acquisition:
- Ideal customer profile. Target companies that retain and grow.
- Channel quality. Invest in channels that bring high LTV cohorts.
Benchmarks By Stage And Model
Early-stage, PLG-heavy SaaS:
- Volatile month to month. Aim for a 3 to 5 ratio on a rolling basis.
Mid-stage, sales-led or hybrid:
- 2 to 4 is healthy if gross churn is under control.
Enterprise-heavy models:
- Lower logo churn, larger expansions. 3 to 6 is common around big releases or renewals.
SMB-heavy models:
- Higher churn pressure. You may need a 3+ ratio to offset natural turnover.
Remember seasonality. Renewals can cluster by quarter. Use rolling averages to smooth the view.
Real-World Story And Lessons Learned
A few years back, our quick ratio hovered at 1.7 for three straight months. We were adding logos fast, but churn was chewing through gains. A cohort review showed most churn came from a segment that loved our price but did not use our advanced features. They left in 60 days.
We fixed onboarding and narrowed our ICP. We added a checklist that pushed new users to complete three key actions in week one. We also introduced a limit on the free tier to push upgrades when value was clear. In 90 days, gross churn fell 30 percent. Expansion rose after we packaged a popular workflow into a mid-tier plan. The quick ratio moved to 3.8 and stayed there.
Lessons:
- You cannot out-sell a leaky bucket.
- Expansion follows clear value moments.
- ICP discipline is a retention strategy.
Related Metrics To Pair With Quick Ratio
Net Dollar Retention. Shows expansion minus churn on existing revenue. Over 120 percent is strong.
Gross Revenue Retention. Shows pure retention without expansion. Over 90 percent is a solid target for many B2B SaaS.
CAC Payback. Months to recover acquisition cost. Pair with quick ratio to judge growth efficiency.
LTV to CAC. Long-term unit economics. Strong quick ratio with weak LTV:CAC can still be risky.
Cohort Retention Curves. Reveal durability by signup month or segment. Great for finding hidden churn drivers.
Frequently Asked Questions Of What Does SaaS Quick Ratio Measure
Q. What Does The SaaS Quick Ratio Actually Measure?
It measures how much recurring revenue you add from new and expanding customers compared to how much you lose from churn and downgrades in a period.
Q. What Is A Good SaaS Quick Ratio?
Above 4 is excellent, 2 to 4 is healthy, 1 to 2 is fragile, and below 1 is unhealthy. Stage, model, and market can shift these ranges.
Q. How Often Should I Track It?
Track monthly, then view 3-month or 6-month rolling averages to reduce noise. Review by segment each quarter.
Q. Does It Include Downgrades Or Only Cancellations?
It includes both. Use churned MRR plus contraction MRR in the denominator for an honest view.
Q. Can A Company Grow With A Low Quick Ratio?
Yes, for a while, if acquisition is strong. But it is risky. Low ratios hide churn and high burn. Fix retention early.
Q. How Is This Different From Net Dollar Retention?
Quick ratio includes new customer revenue. Net dollar retention only looks at existing customers. Use both for a full picture.
Q. Should I Use ARR Or MRR?
MRR is standard for monthly tracking. If you use ARR, keep your period and definitions consistent.
Conclusion
The SaaS quick ratio is your growth health check. It shows if your gains beat your losses and if your model can compound. Track it monthly, smooth it with rolling averages, and dig by cohort. Reduce churn first, then drive expansion with clear value and smart packaging. Start simple: define events, measure cleanly, and act on what you learn. Ready to level up your metrics game? Subscribe for more deep dives, share your quick ratio wins, or drop a question in the comments.
[Insert YouTube Video Here]
>>> Get More Review Here: What Is The Financial Model Of SaaS <<<